
Introduction to RSI (Relative Strength Index)
The Relative Strength Index (RSI) is a momentum oscillator that has become a staple in the toolkit of traders worldwide. Whether you’re a seasoned trader or a newbie looking to dip your toes into the world of forex trading, understanding how to use the RSI indicator can give you a significant edge. In this article, we’ll delve into the intricacies of what is RSI forex, how it works, and how you can use it to make informed trading decisions.
How RSI Works
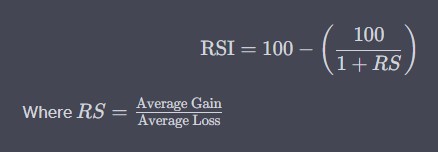
The Formula
RSI is calculated using the following formula:
Time Period
The standard time period for calculating RSI is 14 periods, which could be minutes, hours, or days, depending on your trading strategy.
RSI Range
The RSI oscillates between 0 and 100, providing insights into the momentum and potential reversals in price direction.
How to Interpret RSI Signals
Overbought and Oversold Zones
- Overbought: RSI > 70
- Oversold: RSI < 30
Neutral Zone
- Neutral: 30 < RSI < 70
By understanding these zones, you can better interpret how to use RSI in trading.
Using RSI to Identify Overbought and Oversold Conditions
When the RSI crosses above 70, it’s generally considered overbought. Conversely, when it falls below 30, it’s considered oversold. These are prime opportunities for traders to consider selling or buying, respectively.
Real-Life Example
Imagine the RSI for EUR/USD rises above 70. This could be an indication to sell, as the pair may be overbought and due for a correction.
Using RSI to Identify Trend Reversals
RSI can also be used to identify potential reversals in market trends. A sudden drop in RSI during an uptrend could signify a potential reversal and vice versa.
Statistical Data
According to a study, RSI-based forex RSI strategy has a 60% success rate in predicting trend reversals when used in conjunction with other indicators.
Using RSI to Identify Divergences
Divergence occurs when the price of an asset is moving in the opposite direction of the RSI. This is often a strong indicator of an impending reversal.
Example
If the EUR/USD is making higher highs but the RSI is making lower highs, this is a bearish divergence and could signal a potential downturn.
Combining RSI with Other Technical Analysis Tools
For a more robust trading strategy, consider combining RSI with:
- Moving Averages
- MACD (Moving Average Convergence Divergence)
- Fibonacci Retracements
Limitations and Potential Drawbacks of RSI
| Advantages | Disadvantages |
|---|---|
| Easy to use | Prone to false signals |
| Works well in trending markets | Not ideal for range-bound markets |
| Effective for spotting divergences | Requires confirmation from other tools |
Conclusion: Incorporating RSI into Your Trading Strategy
The Relative Strength Index (RSI) is a versatile tool that can significantly enhance your trading strategy. Whether you’re trading forex, stocks, or commodities, understanding how to use the RSI indicator effectively can help you make more informed decisions.
By paying attention to overbought and oversold conditions, identifying trend reversals, and spotting divergences, you can navigate the complexities of the trading world with greater confidence. However, like all tools, RSI is not without its limitations. It’s crucial to combine it with other technical analysis tools for a more comprehensive trading strategy.
So, the next time you’re pondering about relative strength index forex or relative strength index RSI, remember that it’s not just about the numbers but how you interpret and apply them that counts.