
Forex charts are an essential tool for traders who want to analyze and understand currency movements. These charts provide valuable information about currency prices, trends, and patterns. Understanding how to read forex charts is an important skill for any forex trader. In this article, we will explore the basics of forex charts and provide examples to help you understand how to read them.
What are Forex Charts?
Forex charts are visual representations of currency price movements over time. They are used to analyze and predict trends in the forex market. Forex charts come in different forms and can be displayed in different timeframes. The most common types of forex charts are line charts, bar charts, and candlestick charts.
How to Read Forex Charts?
Reading forex charts requires an understanding of the basic elements of a chart. The following are the essential components of forex charts:
- Timeframe: The timeframe is the period displayed on the chart. It can range from a few seconds to several years. The timeframe you choose will depend on your trading strategy and your analysis goals.
- Price axis: The price axis displays the current price of the currency pair being analyzed. It is usually located on the right side of the chart.
- Chart type: The chart type determines how the price data is displayed. The most common types of charts are line charts, bar charts, and candlestick charts.
- Indicators: Indicators are tools used to analyze price movements and trends. They are displayed on the chart and can be used to identify potential trading opportunities.
- Currency pair: The currency pair being analyzed is displayed on the chart. It is usually located at the top of the chart.
Now that you understand the essential components of forex charts let’s take a look at the different types of charts and how to read them.
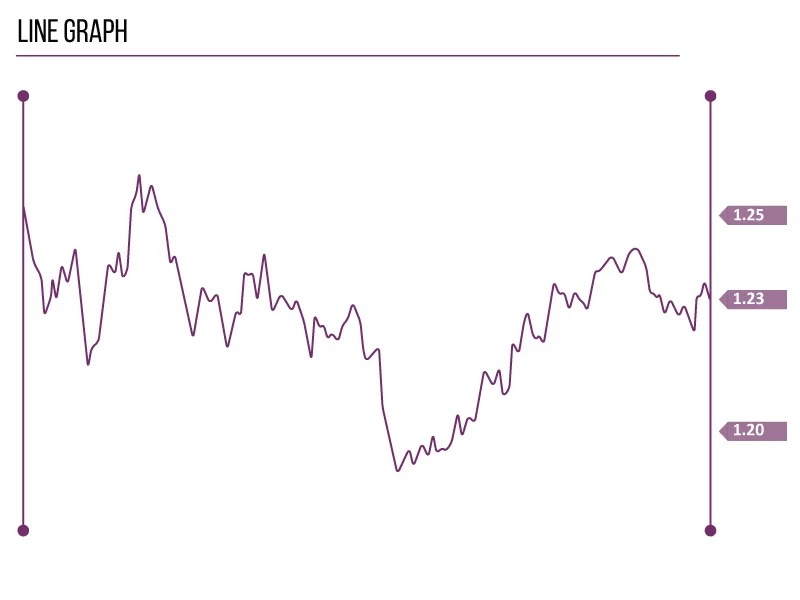
- Line Charts: Line charts are the simplest form of forex charts. They display the closing prices of a currency pair over a specific timeframe. Line charts are useful for identifying long-term trends in the forex market.
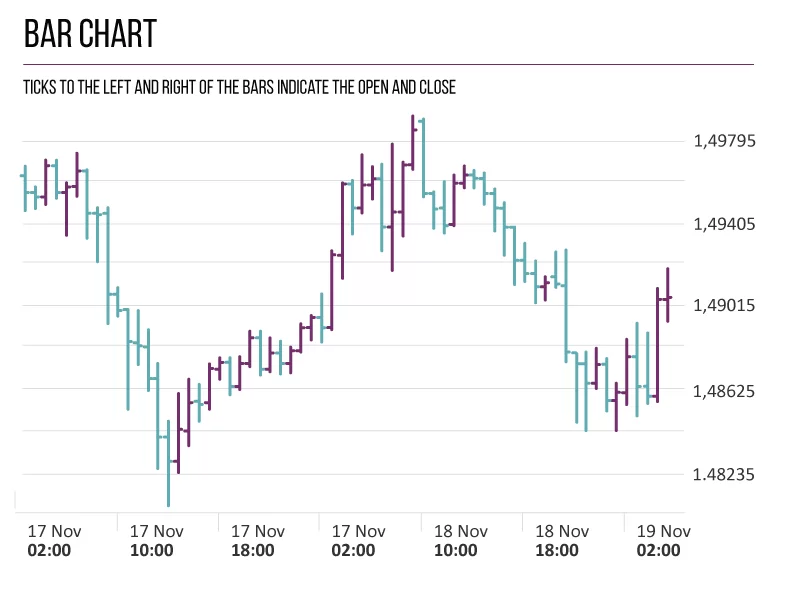
- Bar Charts: Bar charts display the opening, closing, high, and low prices of a currency pair over a specific timeframe. Each bar represents a specific period, such as a day, week, or month. The top of the bar represents the high price, and the bottom of the bar represents the low price. The left and right sides of the bar represent the opening and closing prices, respectively.
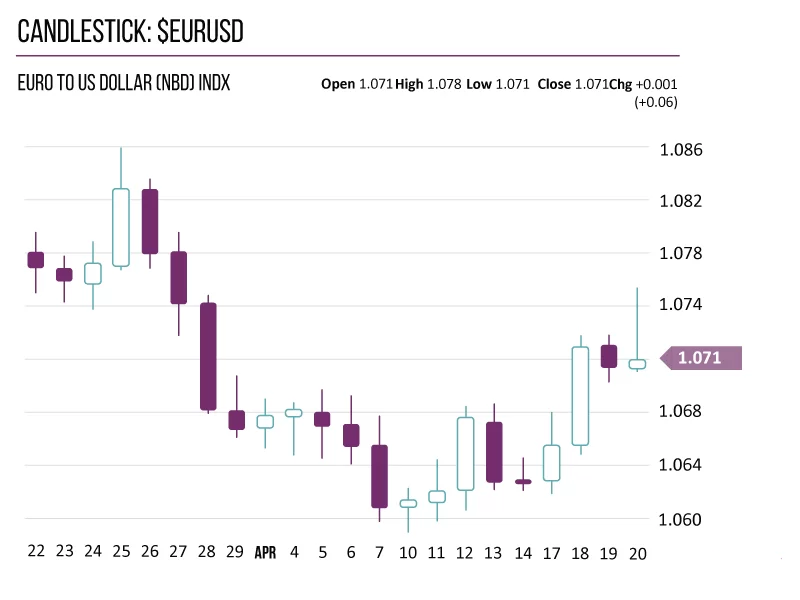
- Candlestick Charts: Candlestick charts are similar to bar charts, but they are more visually appealing and provide more information. Each candlestick represents a specific period, such as a day, week, or month. The body of the candlestick represents the opening and closing prices, and the wicks represent the high and low prices.
Conclusion
Understanding how to read forex charts is an important skill for every forex trader. Forex charts provide valuable information about currency prices, trends and patterns. In this article, we have covered the different types of forex charts, including line charts, bar charts, and candlestick charts, as well as the important components of a forex chart, such as the time frame, price axis, and currency pairs. With a good understanding of forex charts, you will be able to more accurately analyze and predict currency price movements, and make better trading decisions.